Tag Archives: statistics

The Argument Against P-Values

There is concern that a substantial proportion of published research presents largely false findings (Ioannidis, 2005). This problem, in part, stems from social science’s reliance on null hypothesis statistical testing (NHST) given the incentive to achieve statistical significance (e.g., publications, grant funding). Research in the social sciences has historically adopted a Frequentist perspective, primarily reporting results using a dichotomous reject or non-reject decision strategy based on whether some test statistic surpasses a critical value and results in a statistically significant p-value (usually p > 0.05). Although useful in several ways, p-values are largely arbitrary metrics of statistical significance (Greenland et al., 2016), and they are often used incorrectly (Gelman, 2016). The use of p-values encourages a binary mindset when analyzing effects as either null or real, however, this binary outlook provides no information on the magnitude or precision of the effect. P-values can vary dramatically based on the population effect size and the sample size (Cumming, 2008). This reliance on an unstable statistical foundation has been discussed in the literature (Wasserstein, 2016), and while some journals have taken matters into their own hands (for example, Basic and Applied Social Psychology banned p-values and NHST), the field of psychology has largely failed to address the concerns raised by the use of NHST.                                     

Research is moving towards adopting new statistics as best practice, relying instead on estimations based on effect sizes, confidence intervals, and meta-analysis (Cumming, 2014). We, as graduate students in training, are in a position to push towards thinking in terms of estimations and away from dichotomously constrained interpretations. In contrast to the binary nature of p-values, a confidence interval is a set of plausible values for the point estimate. Although perhaps wide, the confidence interval accurately conveys the magnitude of uncertainty of the point estimate (Cumming, 2014), as well as the level of confidence in our results. For example, a 95% confidence interval that includes values for a population mean, μ, indicates 95% confidence that the lower and upper limits are likely lower and upper bounds for μ. The APA Publication Manual (APA, 2020) specifically outlines recommendations to report results based on effect size estimates and confidence intervals, rather than p-values. P-values are not well suited to drive our field forward in terms of precision and magnitude of estimates. Researchers should therefore focus on advancing the field by gaining an understanding of what the data can tell us about the magnitude of effects and the practical significance of those results. It is important for graduate students to adopt practices to produce reproducible and reliable research. One way to do so is to move beyond p-values.

How to move beyond p-values:

  • Prioritize estimation instead of null hypothesis testing or p-values
    • Formulate research questions in terms of estimation. Ex: How large is the effect of X on Y; to what extent does X impact Y?
  • Report confidence intervals and corresponding effect sizes
  • Include confidence intervals in figures (preferred over standard error bars)
  • Make interpretations and conclusions based on the magnitude of the effects rather than a dichotomous decision based on “statistical significance”

References                                                     

American Psychological Association. (2020). Publication manual of the American Psychological Association 2020: the official guide to APA style (7th ed.). American Psychological Association.

Cumming, G. (2008). Replication and p intervals: p values predict the future only vaguely, but confidence intervals do much better. Perspectives on Psychological Science, 3, 286– 300. doi:10.1111/j.1745-6924.2008.00079.x     

Cumming, G. (2014). The new statistics: why and how. Psychological science, 25(1), 7–29. https://doi.org/10.1177/0956797613504966

Gelman, A. (2016). The problems with p-values are not just with p-values. The American Statistician, 70(10).

Greenland, S., Senn, S.J., Rothman, K.J. et al. (2016). Statistical tests, P values, confidence intervals, and power: a guide to misinterpretations. Eur J Epidemiol 31, 337–350. https://doi.org/10.1007/s10654-016-0149-3                                          

Ioannidis, J. P. A. (2005). Why most published research findings are false. PLoS Medicine, 2, e124. Retrieved from http:// www.plosmedicine.org/article/info:doi/10.1371/journal .pmed.0020124

Wasserstein, R.L., & Lazar, N.A. (2016). The ASA’s Statement on p-Values: Context, Process, and Purpose. The American Statistician, 70:2, 129-133, DOI: 10.1080/00031305.2016.1154108

Written by Marianne Chirica, an APAGS Science Committee member and a third-year graduate student in the Psychological and Brain Sciences Ph.D. program at Indiana University. Feel free to reach out to Marianne with any questions you may have!

Scary Statistics: Resources to Help Reduce Fear and Get on with Your Research

Statistics can seem scary and unapproachable: maybe math was not always your strongest subject or you’re still processing the trauma of by-hand ANOVAs in undergraduate statistics classes. Luckily, this blog is designed to help you make friends with statistics and move forward with your research. Specifically, I’ll focus on resources to help guide you through: 1) deciding which statistical analyses to run for a given question and 2) tools to use to run those statistical analyses.


Part 1: Choosing an appropriate statistical analysis

Step 1: Be familiar with commonly-used statistical analyses.

  • This free online self-paced course covers correlations, probability, confidence intervals, and significance tests.
  • This free online self-paced course covers regression, comparing groups, ANOVA, and non-parametric tests.
  • CenterStat provides free videos on youtube, including Structural Equation Modeling (or sign up for a free live class!)
    • They also offer classes on a wide range of more advanced statistics topics for a fee on their website.
  • If you prefer written information, Professor Peggy Kern created very helpful handouts!

Step 2: Choosing a statistical analysis to address your question.

  • You should consider whether the outcome of your analysis is addressing your research question. For example, if you did a correlation but you don’t know what the r value means for your research question, then you have wasted your time.
  • You also want to make sure that your research design/methods meet the requirements for the statistical test. For example, if you wanted to do an independent samples t-test but only have 1 group, then you are using the wrong test.
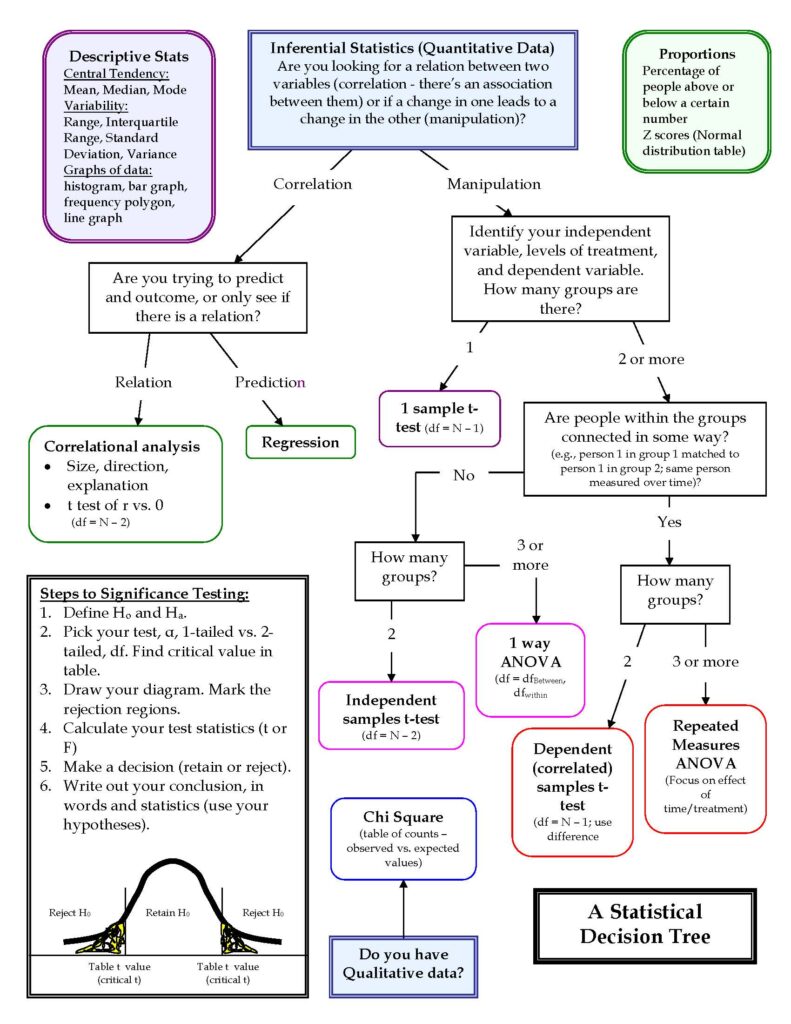
    • Decision trees can help visualize how to narrow down which test to use and what aspects to consider when choosing a test.

Source: https://www.peggykern.org/uploads/5/6/6/7/56678211/edu90790_decision_chart.pdf

Part 2: Using Statistical Software

  • Your University may have access to statistical software such as SPSS, SAS, and Matlab. In addition, R is free to download on their website and provides powerful statistical computing and graphics.

In conclusion, statistics are a powerful tool to use in research. With the right support, you too can learn to use it appropriately and effectively. Do not rush into running statistical tests, but first assess whether the test is appropriate. Learning a new statistical software, like R, takes time. Don’t be discouraged if you are learning it slowly, the best way to learn is to try!

Best of luck on your statistical journey!

Introducing APA’s Journal Article Reporting Standards

Earlier this year the APA revised its Journal Article Reporting Standards (JARS). Originally published in 2008, the 2018 revision provides much-needed updates to APA’s standards for publication and reviews timely issues of debate revolving around reproducibility and preregistration. In addition and for the first time, JARS incorporates guidelines for writing about qualitative/mixed methods research, meaning that the JARS is now specific to either the use of quantitative methods (JARS-Quant) or qualitative (JARS-Qual). Both JARS are accessible as open access publications and appear alongside an editorial introducing the standards within a recent issue of the American Psychologist:

JARS-Quant: Journal Article Reporting Standards for Quantitative Research in Psychology: The APA Publications and Communications Board Task Force Report

JARS-Qual: Journal Article Reporting Standards for Qualitative Primary, Qualitative Meta-Analytic, and Mixed Methods Research in Psychology: The APA Publications and Communications Board Task Force Report

Editorial: Journal Article Reporting Standards

The JARS-Quant and JARS-Qual papers are excellent resources when considered in full. Below we’ve compiled several reasons why APAGS members may be interested in considering these resources when designing and reporting results from their own research and when serving as reviewers.

JARS-Quant

  1. Guidance on how to report non-experimental research

While the JARS-Quant was originally written to offer guidance on how to report studies with experimental manipulations, the 2018 revision offers new guidance on how to report results from studies that are observational, correlational, or which use a natural design (See JARS-Quant Table 3). This expands the scope of JARS considerably and is a much-welcomed resource for those of us who complete non-experimental research.

  1. Inclusion of sophisticated statistical approaches

As the need for more sophisticated statistical approaches for analysis continues to grow, JARS-Quant now offers guidance on what to report when using structural equation modeling (SEM), Bayesian statistics, meta-analytic research methods, and single-case studies (e.g., N-of-1 studies). Inclusion of these diverse approaches to analyzing data offer students up-front transparency in terms of what APA considers appropriate for reporting results from these less ‘straight-forward’ approaches. 

  1. Reporting standards for replication studies

Given heightened interest surrounding issues of reproducibility in psychological science, JARS-Quant provides new guidelines for what to report when publishing a replication study. Authors should consider suitability of replication studies for their individual studies; yet, these guidelines offer a good starting point for what details to consider including in a manuscript so that your study can be considered for replication. Conversely, these guidelines are informative when attempting to replicate another scientist’s work. As new cultural shifts in our field that recognizes the importance and value of replicability, this provides helpful guidance on what information is useful and needed in published manuscripts in order to foster replication science. 

JARS-Qual

  1. Detailed discussion on what constitutes qualitative research and best reporting practices

The JARS-Qual includes a comprehensive yet basic primer for any reader interested in what constitutes qualitative research. In particular, the standards offer guidance regarding the number of participants that typically appear in qualitative research, the types of hypotheses that are tested, modes of data collection, and ways in which hypotheses may be validated. These guidelines further provide much needed clarification on what information needs to be reported and how. 

  1. Recommendations for reviewers reading qualitative research

As editorial board members for Translational Issues in Psychological Science, we often hear from student reviewers that they do not feel comfortable reviewing qualitative manuscripts given a lack of expertise in this arena. As such, we were thoroughly impressed to learn that detailed recommendations for reviewers appear within JARS-Qual (Table 1) to help these individuals better evaluate qualitative research integrity. These guidelines are written in lay language and provide examples of what sections should appear within a qualitative manuscript, thereby providing necessary details to keep handy when consuming qualitative research. 

  1. Inclusion of standards for mixed methods designs

As quantitative and qualitative research vary considerably in terms of design and analysis structure, it is particularly nice to see an entire section detailing how to integrate both methods (See section: Mixed Methods Article Reporting Standards [MMARS]). This makes the JARS-Qual a comprehensive tool for any investigator wishing to complete a stand-alone qualitative study or, alternatively, using limited qualitative data collection to help inform quantitative work.


Author Bios

Jacklynn Fitzgerald, PhD currently serves as the APAGS Member-at-Large for Research and Academic Affairs. She is a post-doctoral research fellow at the University of Wisconsin Milwaukee, Department of Psychology, where she studies the impact of psychological trauma on neural functioning during emotion and emotion regulation. Outside of the lab she considers ways training in psychological science can be improved, and is committed to advancing under-represented students in the sciences, particularly women. She can be contacted here.

Renee Cloutier, MS currently serves as the APAGS Science Committee Chair. She is a fifth year doctoral student in the Experimental Psychology/Behavioral Science program at the University of North Texas and is a F31 recipient from NIDA/NIH. She studies the role of anxiety and social context in substance use behaviors/cognitions among adolescents and emerging adults. In addition to her research, she seeks ways to promote science within psychology and devotes her time to mentoring younger students. She can be contacted here.